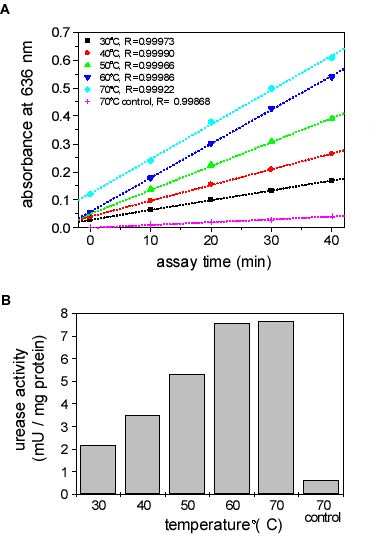
Figure A shows the time points obtained during the urease assay and the
results of a regression analysis
Figure B shows the activities calculated from the slopes determined in
A.
The control consisted of a urea solution (same concentration as in the
assay: 50 mM) in gel filtration buffer. It was included to evaluate the
non-enzymatic breakdown of urea at higher temperatures.